Cappitech Dashboard gets an update – what’s new?
Of our product features, our dashboard is one that we are very proud of. First released in 2016, the web-based dashboard provides customers a visual display of their regulatory report submissions. It also allows for customers to access their raw files of uploads and messages to Trade Repositories and ARMs.

Since launching the first dashboard in 2016, Cappitech has been steadily adding new features. Included has been the rollout of multi-jurisdiction support for customers to be able to view reports of different regulation on a single interface. Also, as part of our goal to add useful analytics tools to the dashboard, Best Execution Monitoring launched in early 2018 as part of our MiFID II update.
New look and features
For Q3, Cappitech has again made a new update of features and design in our dashboard to better service clients. New features include:
Faster – To improve performance, Cappitech underwent an upgrade of our database infrastructure to support larger sets of data analysis. With the changes, customers will experience faster load times of reports. This is especially important when viewing larger multi-month sets of reports.
Downloading reports is easier – One of the big changes has been the removal of our ‘File Management’ tab. Rather than entering a separate page to download raw trade report files, they can now be downloaded directly from the main report analysis page. By clicking on the trade date, users will see a download icon to download their data.

More regulation – Cappitech clients can view their EMIR, MIFIR and ASIC derivative reporting results on the dashboard. The infrastructure was now widened to support Canadian reporting, FinfraG and SFTR (when it goes live) with a single login.
Best Execution Monitoring Facelift
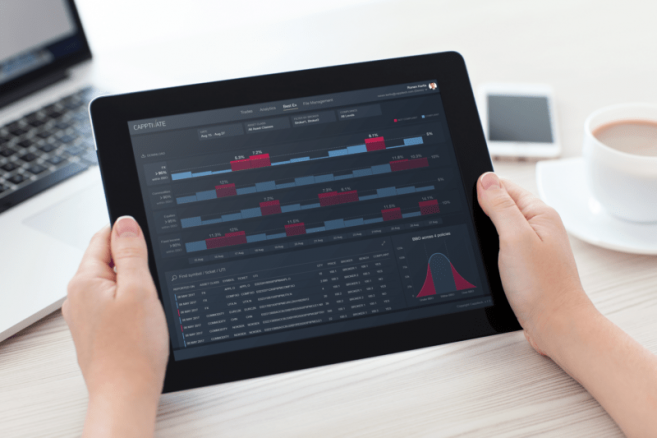
The biggest changes in the current update were with our Best Execution Monitoring system (learn more). Some of the updates include:
Histogram – A new histogram was introduced in this version. The histogram shows how many of the trades were within the current policy spread, above or below it. It also shows the distribution of the execution price along the policy spread, which gives an indication of the concentration of the executions around the market mid-price.

Policy filters – Cappitech has made it easier to drill down to specific trades with improved filtering.
More analytics – We added a new legend that shows the count of all trades in the screen that were outside of the policy spread (“OUTSIDE”) and within the policy (“WITHIN”). These results change as users apply and remove various filters .
Policy benchmarks – The look of the Benchmark column has been updated. It now shows more information, specifically, the spread is divided into Market Spread (The actual spread that was in the market at execution time) and the Policy Tolerance (The tolerance that is added to the market spread per the policy definition)

Related Articles


UK vs. EU MiFID II Transparency Amendments: What’s Changing and What It Means for You